
Integrated Application & Infrastructure Monitoring


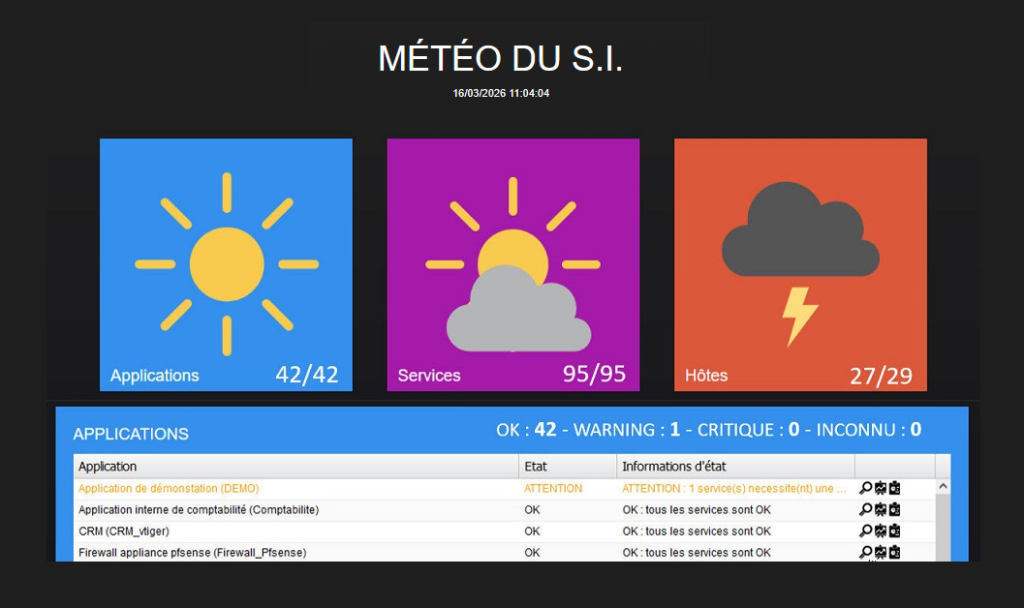

Consolidated Application Health (“IT Weather”) Comprehensive views of overall application status, consolidating technical component data with real-time functional and performance test scenarios.
Automated Dashboards & Performance Analytics Pre-formatted reports tracking application availability against SLAs, including predictive capacity planning and dated saturation risk forecasts.
Proactive Smart Alerting Detailed notifications for application malfunctions or performance degradation, designed to anticipate risks and enable a truly proactive management approach.
Advanced Diagnostics & Visual Mapping Intuitive drill-down features and dynamic application maps to quickly identify, diagnose, and pinpoint the root cause of active alerts.
Fonctionnalites integrées
IT Weather
Real-time operational status of your applications, services, hardware, and IT infrastructure. Whether it’s stormy, cloudy, or sunny, you’ll know at a glance whether to take action or stay confident.
Daily & Periodic Status Reports
Access a complete daily operational report in a single click, or select a specific period, device, or application to automatically generate personalized reports. These include availability rates compared to service commitments, malfunction analysis, resource status, and support for problem management.
Tableau de bord
Mettez à disposition un tableau de bord public pour montrer l'état de votre SI à votre organisation.
Placez y les indicateurs de votre choix.
Diffusez des messages de la DSI pour prévenir des opérations plannifiées.
Detailed Alerting
Receive clear notifications identifying the root cause, application impacts, and severity levels. Access contextual links to quickly diagnose issues or escalate them to the right contact.
Availability
In just a few clicks, generate summary reports on the availability and operation of your entire IT infrastructure or specific applications.
Capacity
Quickly access infrastructure capacity status, trends, and dated saturation forecasts. Easily optimize your resources and anticipate future disk space needs.
Live maps
Access fully integrated Nagvis to see your physical and logical maps update in real time based on live monitoring status.
These dynamic views provide IT teams with an alternative perspective of the infrastructure's operating state.
Monitoring plugins
A vast library of ready-to-use check plugins is included, covering:
OS: Windows, Linux, etc.
Databases: Oracle, MS-SQL, MySQL, PostgreSQL
Network & Storage: Fortigate, DataCore, FalconStor
Missing a specific plugin? You can easily add as many as you need to ensure full visibility of your infrastructure.